
Business Intelligence for Human Resource
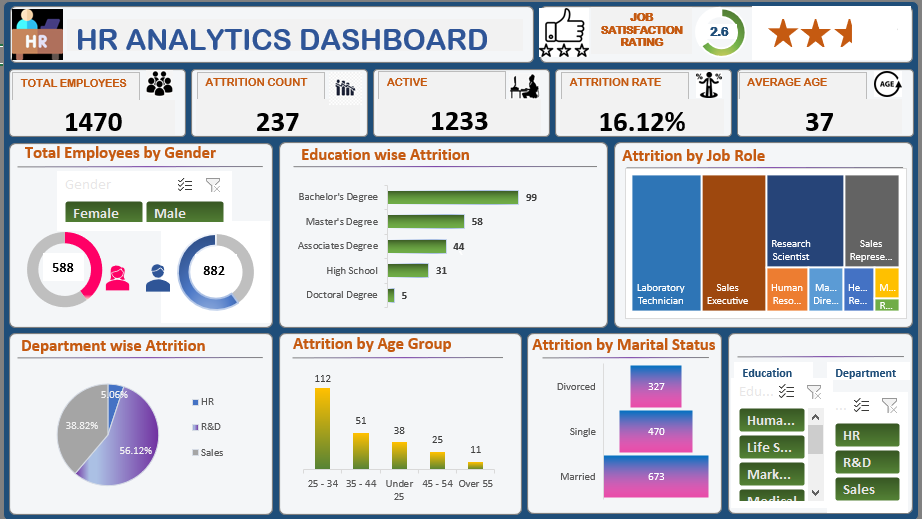
The dashboard below shows key details from data of staff of a fictional company with a total of 1470 staff with a focus on attrition rate.
Tools: Excel, Pivot Tables
It contains information across business travel, age band, attrition, department, education field, employee number, job role, gender, marital status, age, over time, attrition count, attrition rate, current employees, daily rate, distance from home, employee count, education, environment satisfaction, hourly rate, job involvement, job level, job satisfaction, monthly income, monthly rate, total working years, work life balance, years in current role, stock options, performance rating, number of companies worked, percent salary hike, total working years, years at company, years in current role, years since last promotion, years with current manager
To design this dashboard, the following key points were focused on;
- Job Satisfaction Rating
- KPIs: Total Employees, Attrition Count, Average Age, Active Employees, Attrition Rate
- Total Employees by Gender
- Education wise Attrition
- Attrition by Job Role
- Department wise Attrition
- Attrition by Age Group
- Attrition by Marital Status
